Colored longitudinal river profiles
Did you ever face the problem that you wanted to plot additional variables together with the two spatial dimensions of a river profile. One such variable could be ksn values, or gradient, or lithological identifiers. I recently had this problem, then coded a solution, and now uploaded an updated version of STREAMobj/plotdz.
Such additional variables must be available as so-called node-attributed lists (nal). These lists are column vectors that have as many elements as there are nodes in the stream network. A STREAMobj S has a couple of such nal as properties, e.g. S.x, S.y or S.IXgrid. S.x and S.y are coordinate vectors that locate each node in a projected coordinate system. S.IXgrid is a vector of linear indices into the DEM from which S was derived. nal are returned by a number of STREAMobj methods such as STREAMobj/gradient, STREAMobj/streamorder, STREAMobj/curvature, and STREAMobj/chitransform, among others. Alternatively, you can derive a nal using getnal. For example, a nal with elevation values is simply obtained by
z = getnal(S,DEM);
Now how can you plot colored river profiles. Line objects as produced by the function plot do not support gradually varying colors. As far as I know, there are three work-arounds. The first approach is to plot each line segment with variable colors using the low-level function line. This, however, would probably take ages for large stream networks with thousands of individual line segments. The second approach is to plot the line as a surface with colored edges. This old-time-hack works quite well and leaves you with all the options that surface objects offer. The third approach is one that I came across when reading through Yair Altman’s undocumented MATLAB blog. He reports on some undocumented line properties that were introduced with MATLAB’s new graphics engine in R2014b. I implemented the surface approach and the undocumented approach and let you choose.
Ok, now let’s see the updated plotdz-function in action:
load exampleDEM
DEM = GRIDobj(X,Y,dem);
FD = FLOWobj(DEM,'preprocess','carve');
A = flowacc(FD);
S = STREAMobj(FD,A>100);
S = klargestconncomps(S);
z = imposemin(S,DEM);
s = streamorder(S);
subplot(2,1,1)
plotdz(S,DEM,'color',s,'LineWidth',1,'cbarlabel','Stream order')

g = gradient(S,z);
c = chitransform(S,A,'mn',0.45);
subplot(2,1,2)
plotdz(S,DEM,'color',g,'LineWidth',1,'distance',c,'cbarlabel','Gradient [m/m]')
xlabel('\chi [m]')
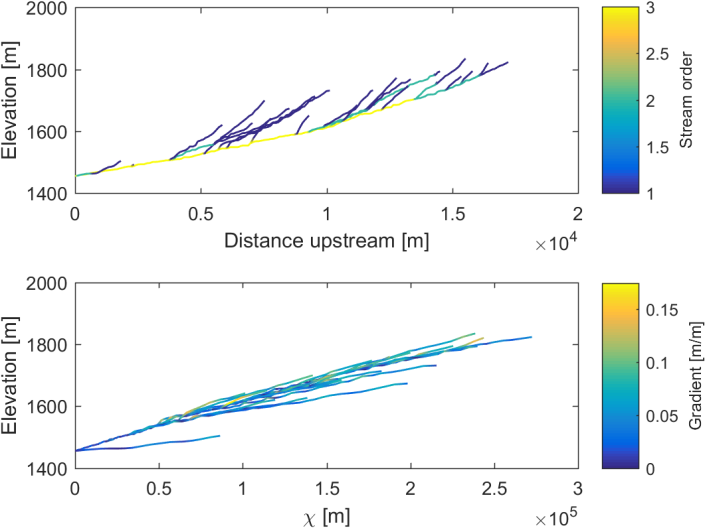
Now that looks quite ok. Also note the option to modify the values of the upstream distance that allows you to easily plot Χ-plots without using the function chiplot.
Hope that functions turns out to be useful for you.

October 26, 2016 at 4:12 am
Wolfgang, this was overdue. Great job!
May 8, 2017 at 3:47 pm
Dear Wolfgang, many thanks for your impressive work!
When trying to reproduce this example on the srtm_bigtujunga30m_utm11.tif DEM, I got this error on the plotdz command: “Error using plotdz
‘LineWidth’ is not a recognized parameter. For a list of valid name-value pair
arguments, see the documentation for plotdz.”
When I am trying to run: plotdz(S,DEM,’color’,s)
I get the following error: “Error using plot
Color value must be a 3 element vector
Error in STREAMobj/plotdz (line 172)
ht = plot(d,z,’-‘,’Color’,p.Results.color);”
How can I proceed? many thanks!
May 8, 2017 at 6:41 pm
Hi Alberto, thanks for your comment. Are you using the latest version of topotoolbox? Only the latest version available here: https://github.com/wschwanghart/topotoolbox supports the option as well as colored profile plots. It doesn’t work if you have downloaded the version here: https://github.com/csdms-contrib/topotoolbox .
Hope this helps,
W.
May 10, 2017 at 3:57 pm
It helped a lot!
Thanks,
Alberto
February 20, 2019 at 12:10 pm
Hi Wolfgang,
if I create a .tif file that represent the geology (the geology is represented by numbers, for example pixel values 1 = limestones, pixel values 2= sandstones etc…), is it possible color my long river and chi profiles according to the geology?
Thanks,
Simone
February 20, 2019 at 10:13 pm
Hi Simone, sure. This is possible. Following code snippet will hopefully work because I haven’t tested it. I assume your geology raster is a GRIDobj GEO.
To plot the profile in chi-space:
Best regards
Wolfgang
February 21, 2019 at 9:27 am
Thank you!
February 22, 2019 at 10:49 am
Dear Alberto,
How did you load the srtm_bigtujunga30m_utm11.tif DEM? Can you please help me to load my DEM and run this code?
February 20, 2019 at 2:24 pm
Hi Wolfgang,
If I have a .tif map that represent the geology, is there a way to color my long river profiles according to geology? In my map geology are classified by numerical values of the pixels (es. pixel values 1 = limestone, 2 = sandstones etc.)
February 20, 2019 at 3:51 pm
Superb application Wolfgang. May I suggest a function to plot distance/elevation + gradient from Chi space for selected streams. It will be useful to analize anomaulous steep gradients and their relation to KPs
February 20, 2019 at 10:17 pm
Hi Allan, well, that option exists. See my previous comment to Simone Racano above. plotdz takes a distance argument that allows using custom distances, e.g. chi.
Best, Wolfgang
February 21, 2019 at 9:15 am
Dear wschwanghart, I am new to MATLAB. I have started using it for my research work. Using code for colored longitudinal profiles, I have constructed colored long profile of Bhagirathi River Basin, in which there are up to 6 orders of streams as per Strahler’s ordering system. But the problem is the color bar shows only up to 3 rd order stream. I don’t know how to correct it. Please help me.
February 21, 2019 at 9:36 am
Hi manish7sep, please see the function colormap (e.g. colormap(parula(6))).
February 23, 2019 at 9:03 am
I need help:
My results for these two are exactly the same
First:
load exampleDEM
DEM = GRIDobj(X,Y,dem);
FD = FLOWobj(DEM,’preprocess’,’carve’);
A = flowacc(FD);
S = STREAMobj(FD,A>100);
S = klargestconncomps(S);
z = imposemin(S,DEM);
s = streamorder(S);
subplot(2,1,1)
plotdz(S,DEM,’color’,s,’LineWidth’,1,’cbarlabel’,’Stream order’)
g = gradient(S,z);
c = chitransform(S,A,’mn’,0.45);
subplot(2,1,2)
plotdz(S,DEM,’color’,g,’LineWidth’,1,’distance’,c,’cbarlabel’,’Gradient [m/m]’)
xlabel(‘\chi [m]’)
Second:
DEM = GRIDobj(‘Bhag_Full_Fill.tif’);
DEM = GRIDobj(X,Y,dem);
FD = FLOWobj(DEM,’preprocess’,’carve’);
A = flowacc(FD);
S = STREAMobj(FD,A>100);
S = klargestconncomps(S);
z = imposemin(S,DEM);
s = streamorder(S);
subplot(2,1,1)
plotdz(S,DEM,’color’,s,’LineWidth’,1,’cbarlabel’,’Stream order’)
g = gradient(S,z);
c = chitransform(S,A,’mn’,0.45);
subplot(2,1,2)
plotdz(S,DEM,’color’,g,’LineWidth’,1,’distance’,c,’cbarlabel’,’Gradient [m/m]’)
xlabel(‘\chi [m]’)
I want to run the code for my dem data “Bhag_Full_Fill.tif”. But I don’t know how to do it.
Please help me. I am new to Matlab and don’t understand the underlying logic of ‘set of codes’.
PLEASE HELP
February 23, 2019 at 3:45 pm
Manish, take a look at the second line in the Second example. Here you overwrite your DEM Bhag_Full_Fill with the example DEM.
February 24, 2019 at 4:39 am
I tried again but not successful. I would be obliged if you please edit the code in the second example. Sincere thanks for your responses🙏🏻
February 24, 2019 at 6:44 pm
Dear Manish, remove the second line of the second example. That’s all.
February 25, 2019 at 4:28 am
No no no…Wolfgang Sir,
This time, I run the code after implementing your suggestion into the code with five set of DEMs. One for small catchment (basin area ~1262.25 square kilometers) and three with large (17477.10 square kilometers, 165474.89 and 226652.99 sq.km). But for all the large DEMs, there were error messages. The messages read “Warning: Error creating or updating LineStrip……”
“> In defaulterrorcallback (line 12)….In STREAMobj/plotdz (line 248)”….and the error message continues. If you want and allow me, I will send you the screenshots of error messages. (please send me your email id, I’ll send all the matlab files, error message screenshots…..and I can give you co-authorship, it it takes considerable time for you to resolve the issues.) Thank you
February 25, 2019 at 4:29 am
And yes, for the smaller DEM, it had run successfully.
March 6, 2023 at 8:22 pm
Dear wschwanghart,
I want to apply the best fit curve to the longitudinal profile of a drainage basin, but how can I transfer long profile data to Excel?
March 6, 2023 at 9:19 pm
Hello, please ask questions on github. We are now answering questions on github discussions: https://topotoolbox.wordpress.com/2023/03/05/seeking-for-help-lets-meet-on-github-discussions/
May 3, 2024 at 3:57 pm
Dear Wolfgang,
Is it possible to draw two longprofiles of different basins in a single plot.
Thank you
May 3, 2024 at 4:39 pm
Dear Vandana,
if you use plotdz to plot a longitudinal profile, it will plot all stream networks stored in STREAMobj in the same axes. See here:
Best, Wolfgang
May 6, 2024 at 9:09 am
Thank you very much ..