Basic topographic metrics about the South Lhonak Lake outburst and the Chungthang Dam disaster
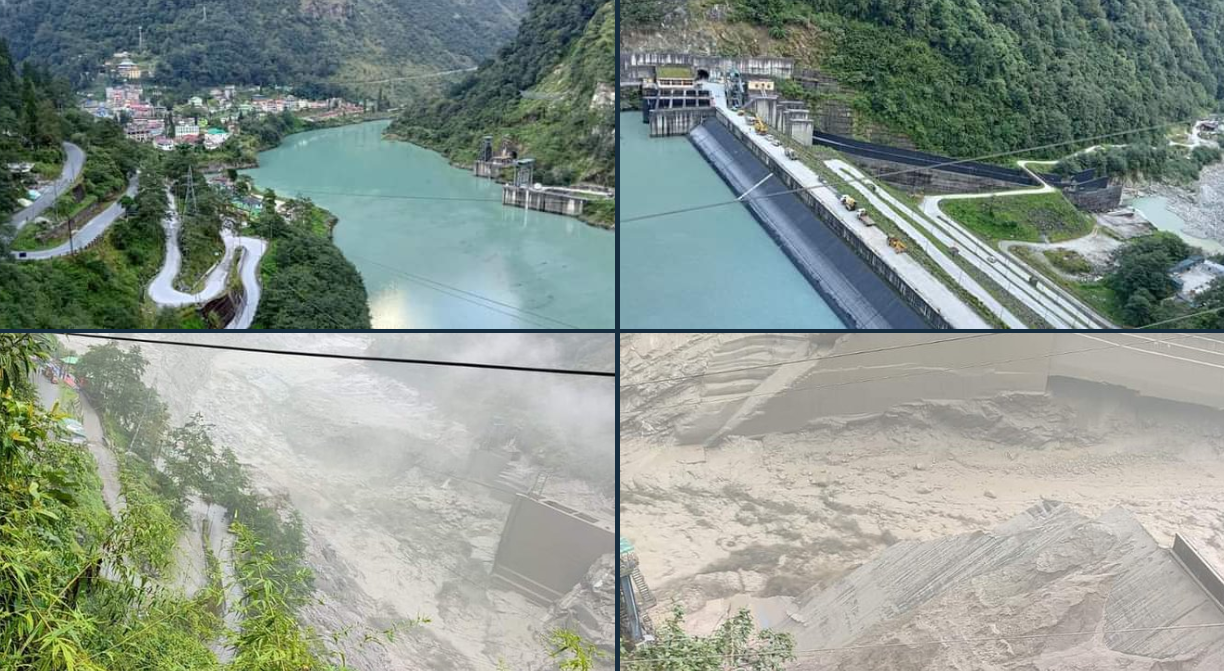
The river Teesta in the Indian Himalayan state Sikkim experienced severe flooding today. At the time of writing, at least five people died and 23 Indian Army troops are still missing. Moreover, Chungthang Dam, a 330 MW hydropower project has been severely damaged. The cause of the damage is a flash flood, likely triggered or amplified by the outburst of the glacial lake South Lhonak. This is not the first hydropower incident related to GLOFs. Thus, the GLOF and its inflicted damages once again exemplify the exposure of Himalayan hydropower to glacial hazards (Schwanghart et al., 2016).
In this short tutorial, I will briefly show how to use TopoToolbox to retrieve some basic metrics concerning the relation between the lake and the hydropower project. We will download a DEM, derive flow directions and analyze the flow path emanating from South Lhonak Lake. To this end, we will visualize the results.
First, let’s retrieve the coordinates of the lake and the hydropower project. The lake has a Wiki entry, and the project is this one:
% https://en.wikipedia.org/wiki/South_Lhonak_Lake
% (Link indicates the wrong location. The coordinates below were updated)
lllake = [ 27.9129  88.1993];;
% https://www.gem.wiki/Teesta_Stage_II_hydroelectric_plant
% (Initial locations were wrong. Thanks for pointing this out, Thomas Geay)
llhep  = [27.59814509634865, 88.65060180055883];
Based on these coordinates, let’s calculate the extent (west, east, south, north) of the DEM which we will download using the function readopentopo. Note that I add some margin to retrieve a DEM that is slightly larger than the extent.
extent = [lllake(2)-0.1 llhep(2)+0.1 llhep(1)-0.1 lllake(1)+0.1];Now we can download the DEM. Since the DEM comes in geographic coordinates (WGS 84), we will project it to UTM-coordinates.
DEM = readopentopo('extent',extent, ...
                   'demtype', 'cop30');
DEM = reproject2utm(DEM,30);
Based on the DEM, we calculate flow directions using FLOWobj.
FD = FLOWobj(DEM);Now, we will need to project the coordinates of the lake. Moreover, we calculate the linear index of the lake, i.e. the linear index of the grid cell in the DEM.
[xlake,ylake] = projfwd(DEM.georef.mstruct,lllake(1),lllake(2));
ixlake = coord2ind(DEM,xlake,ylake);
Then, we’ll calculate the path emanating from the lake using STREAMobj.
S = STREAMobj(FD,'channelheads',ixlake);Now we calculate the location of the hydropower project. snap2stream converts latitudes/longitudes to the projected coordinate system of the grid object while snapping the location to the stream network.
[xhep,yhep,ixhep] = snap2stream(S,llhep(1),llhep(2),'inputislatlon',true);Now let’s visualize the data. Because they are easier to read, we’ll calculate distances in km from the lake.
subplot(1,2,1)
imageschs(DEM,[],'colormap',ttcmap(DEM,'cmap','france'))
hold on
plot(S,'color','b')
plot(xlake,ylake,'o','markerfacecolor','b')
plot(xhep,yhep,'ks','markerfacecolor','k')
niceticks

d = distance(S,'max_from_ch') / 1000;
subplot(1,2,2)
plotdz(S,DEM,'distance',d,'color','k',...
    'annotation',ixhep,'annotationtext',{'HEP'})
hold on
S2 = modify(S,'upstreamto',ixhep);
d2 = nal2nal(S2,S,d);
plotdz(S2,DEM,'distance',d2,'color','b')
xlabel('Distance from lake [km]')
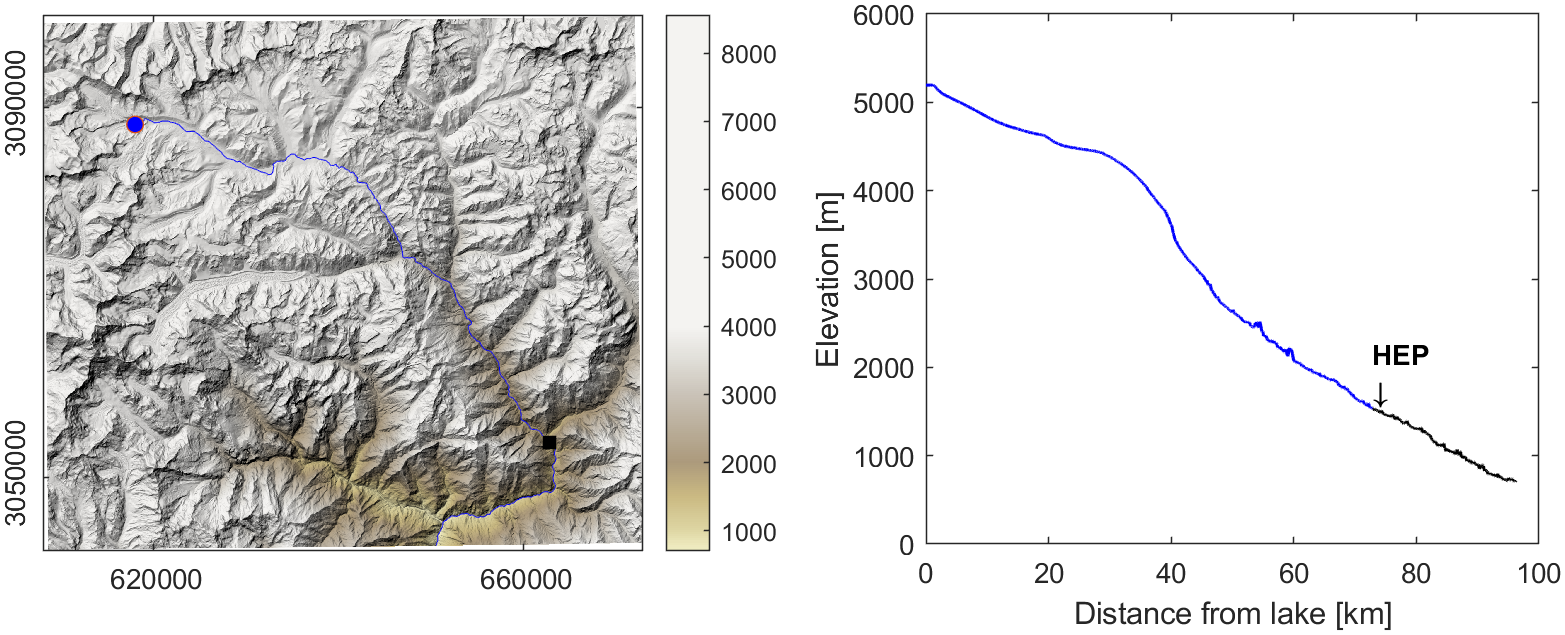
Based on this data, we can retrieve some basic metrics to characterize the flow path between the lake and the hydropower project.
The distance in [km] from the lake to the project is:
round(max(d2))

ans =

    73
The elevation range in [m] of the path is calculated as
round([max(getnal(S2,DEM)) min(getnal(S2,DEM))])

ans =

        5197        1532
This means, the flood from the lake started at ~5200 m and dropped by 3665 m within 73 km. That is a staggering river gradient of 0.05 m/m. In fact, from the river profile above, it can be seen that the river traverses some modestly steep reaches before it plunges into the steep Lashar and Laachen Valleys. The highly convex profile suggests that the flood may have accelerated strongly during its downstream path.
Hydropower in the Himalayas has recently experienced a large number of incidents due to natural hazards. This event will certainly attract high interest from the research community as South Lohnak Lake was considered dangerous due to its rapid growth since the 1960s (Raj et al. 2013) and its exposure to avalanches (Sattar et al., 2019, 2021). In fact, previous studies emphasized the need for GLOF mitigation measures and environmental impact assessments that fully account for GLOF hazards (Sattar et al., 2021).
[The post was updated because the computations involved an incorrect location of South Lhonak Lake. Thanks Georg Veh for spotting the error. Also, Thomas Geay pointed out an error in the location of the HEP in the comments. The code and calculations were corrected.]
References
Raj, K. Babu Govindha; Remya, S. N.; Kumar, K. Vinod (2013). “Remote sensing-based hazard assessment of glacial lakes in Sikkim Himalaya”. Current Science. 104 (3): 359–364.
Sattar, A., Goswami, A., and Kulkarni, A. V. (2019): Hydrodynamic moraine-breach modeling and outburst flood routing – A hazard assessment of the South Lhonak lake, Sikkim, Science of The Total Environment, 668, 362–378, https://doi.org/10.1016/j.scitotenv.2019.02.388.
Sattar, A., Goswami, A., Kulkarni, Anil. V., Emmer, A., Haritashya, U. K., Allen, S., Frey, H., and Huggel, C. (2021): Future Glacial Lake Outburst Flood (GLOF) hazard of the South Lhonak Lake, Sikkim Himalaya, Geomorphology, 388, 107783, https://doi.org/10.1016/j.geomorph.2021.107783.
Schwanghart, W., Worni, R., Huggel, C., Stoffel, M., Korup, O. (2016): Uncertainty in the Himalayan energy-water nexus: estimating regional exposure to glacial lake outburst floods. Environmental Research Letters, 11, 074005. [DOI: 10.1088/1748-9326/11/7/074005]

December 21, 2023 at 1:20 pm
Thank you for your job, I was exactly looking for this type of information!
However, the coordinates of the Chungthang dam are note the one shown in the computation. The damaged dam is located here: 27.59814509634865, 88.65060180055883. (elevation ~ 1790 m, at about 70km from South Lhonak Lake).
December 23, 2023 at 9:34 pm
Thanks, Thomas, you are absolutely right with the location of the dam. I’ll check that again and rerun the code. Best, Wolfgang
December 23, 2023 at 9:50 pm
Ok, corrected! Thanks a lot for your comment!